Enterprise Social Media Analytics and Reporting
Apaya Enterprise reports post-level, campaign-level, and channel-level performance across LinkedIn, Instagram, Facebook, X, and TikTok for every brand in the workspace. Teams can view reporting in the dashboard, export reports as PDF, CSV, and Markdown, or expose reporting data through scoped Enterprise API access for downstream systems. Markdown exports make reporting easy to feed into internal AI, LLM, and agent workflows. Where campaign links and the Apaya tracker are installed on the brand's website, analytics extend to visitor behavior, source visibility, and conversions.
Enterprise social reporting breaks when brand, campaign, channel, post, and website outcomes live in different places. The team needs to know which posts worked, which campaigns moved, which channels contributed, and what happened on the website after someone clicked.
Apaya Enterprise reports on what it produced and what happened after it shipped. Post, campaign, channel, and brand performance live in the dashboard. Teams can export reports as PDF, CSV, and Markdown, and enterprise customers can expose reporting data through the Enterprise API when they want Apaya data in their own BI tools, internal systems, or AI workflows. Where campaign links and the Apaya tracker are installed on the brand’s website, analytics extend to visitor behavior, source visibility, and conversions.
What enterprise teams need from social media analytics
Most enterprise marketing teams need three things from social media analytics:
- Per-post performance. Which captions, images, hashtags, and formats worked. Engagement, reach, clicks per post.
- Per-campaign rollup. How an entire campaign performed across channels. Impressions, engagement, click-through, conversion where tracked.
- Outcome reporting. What happened after the click. Did the visitor land on the website. Did they convert. Which campaign links and tracked sources contributed to the outcome.
The first two are table stakes. Every social tool reports on them. The third is the line from social content to website outcome, which is where most tools fall short because they end at the channel API.
Apaya covers all three for buyers who install the tracker on the brand’s website. For buyers who do not, Apaya covers the first two and integrates with whatever conversion tracking is in place. The reporting starts with the enterprise social media scheduling and publishing layer because every published post already belongs to a brand, campaign, channel, and lifecycle state.
How Apaya’s enterprise social media analytics work
Analytics are scoped per brand. Each brand connects its social accounts; Apaya pulls performance data from the channel APIs.
The data model:
- Post-level analytics. Engagement, reach, impressions, clicks per post.
- Campaign analytics. Aggregated performance across every post in a campaign. UTM tracking on campaign links for downstream attribution.
- Platform analytics. Performance per channel, with platform-specific metrics where the API exposes them.
- Follower statistics. Account-level follower counts and growth where the channel exposes them.
- Time filtering. Preset windows (last 7, 30, 90 days, last quarter, last year) and custom date ranges.
Where the Apaya tracker is installed on the brand’s website, analytics extend to:
- Visitor and session tracking. Pageviews, sessions, events from social-driven traffic.
- Known-user visibility. Anonymous visitors can connect to known users after login, signup, or form submission where the site is configured to pass that event.
- Acquisition reporting. Campaign links, UTMs, and tracked website events help connect social content to website outcomes.
- Behavior reporting. Activity, content, country, device, operating system, visitor-level views.
Analytics are brand-scoped by default. Each brand has its own reporting view for posts, campaigns, channels, and website activity where tracking is installed. If corporate marketing needs a consolidated executive view across brands, that reporting layer can be scoped during enterprise rollout.
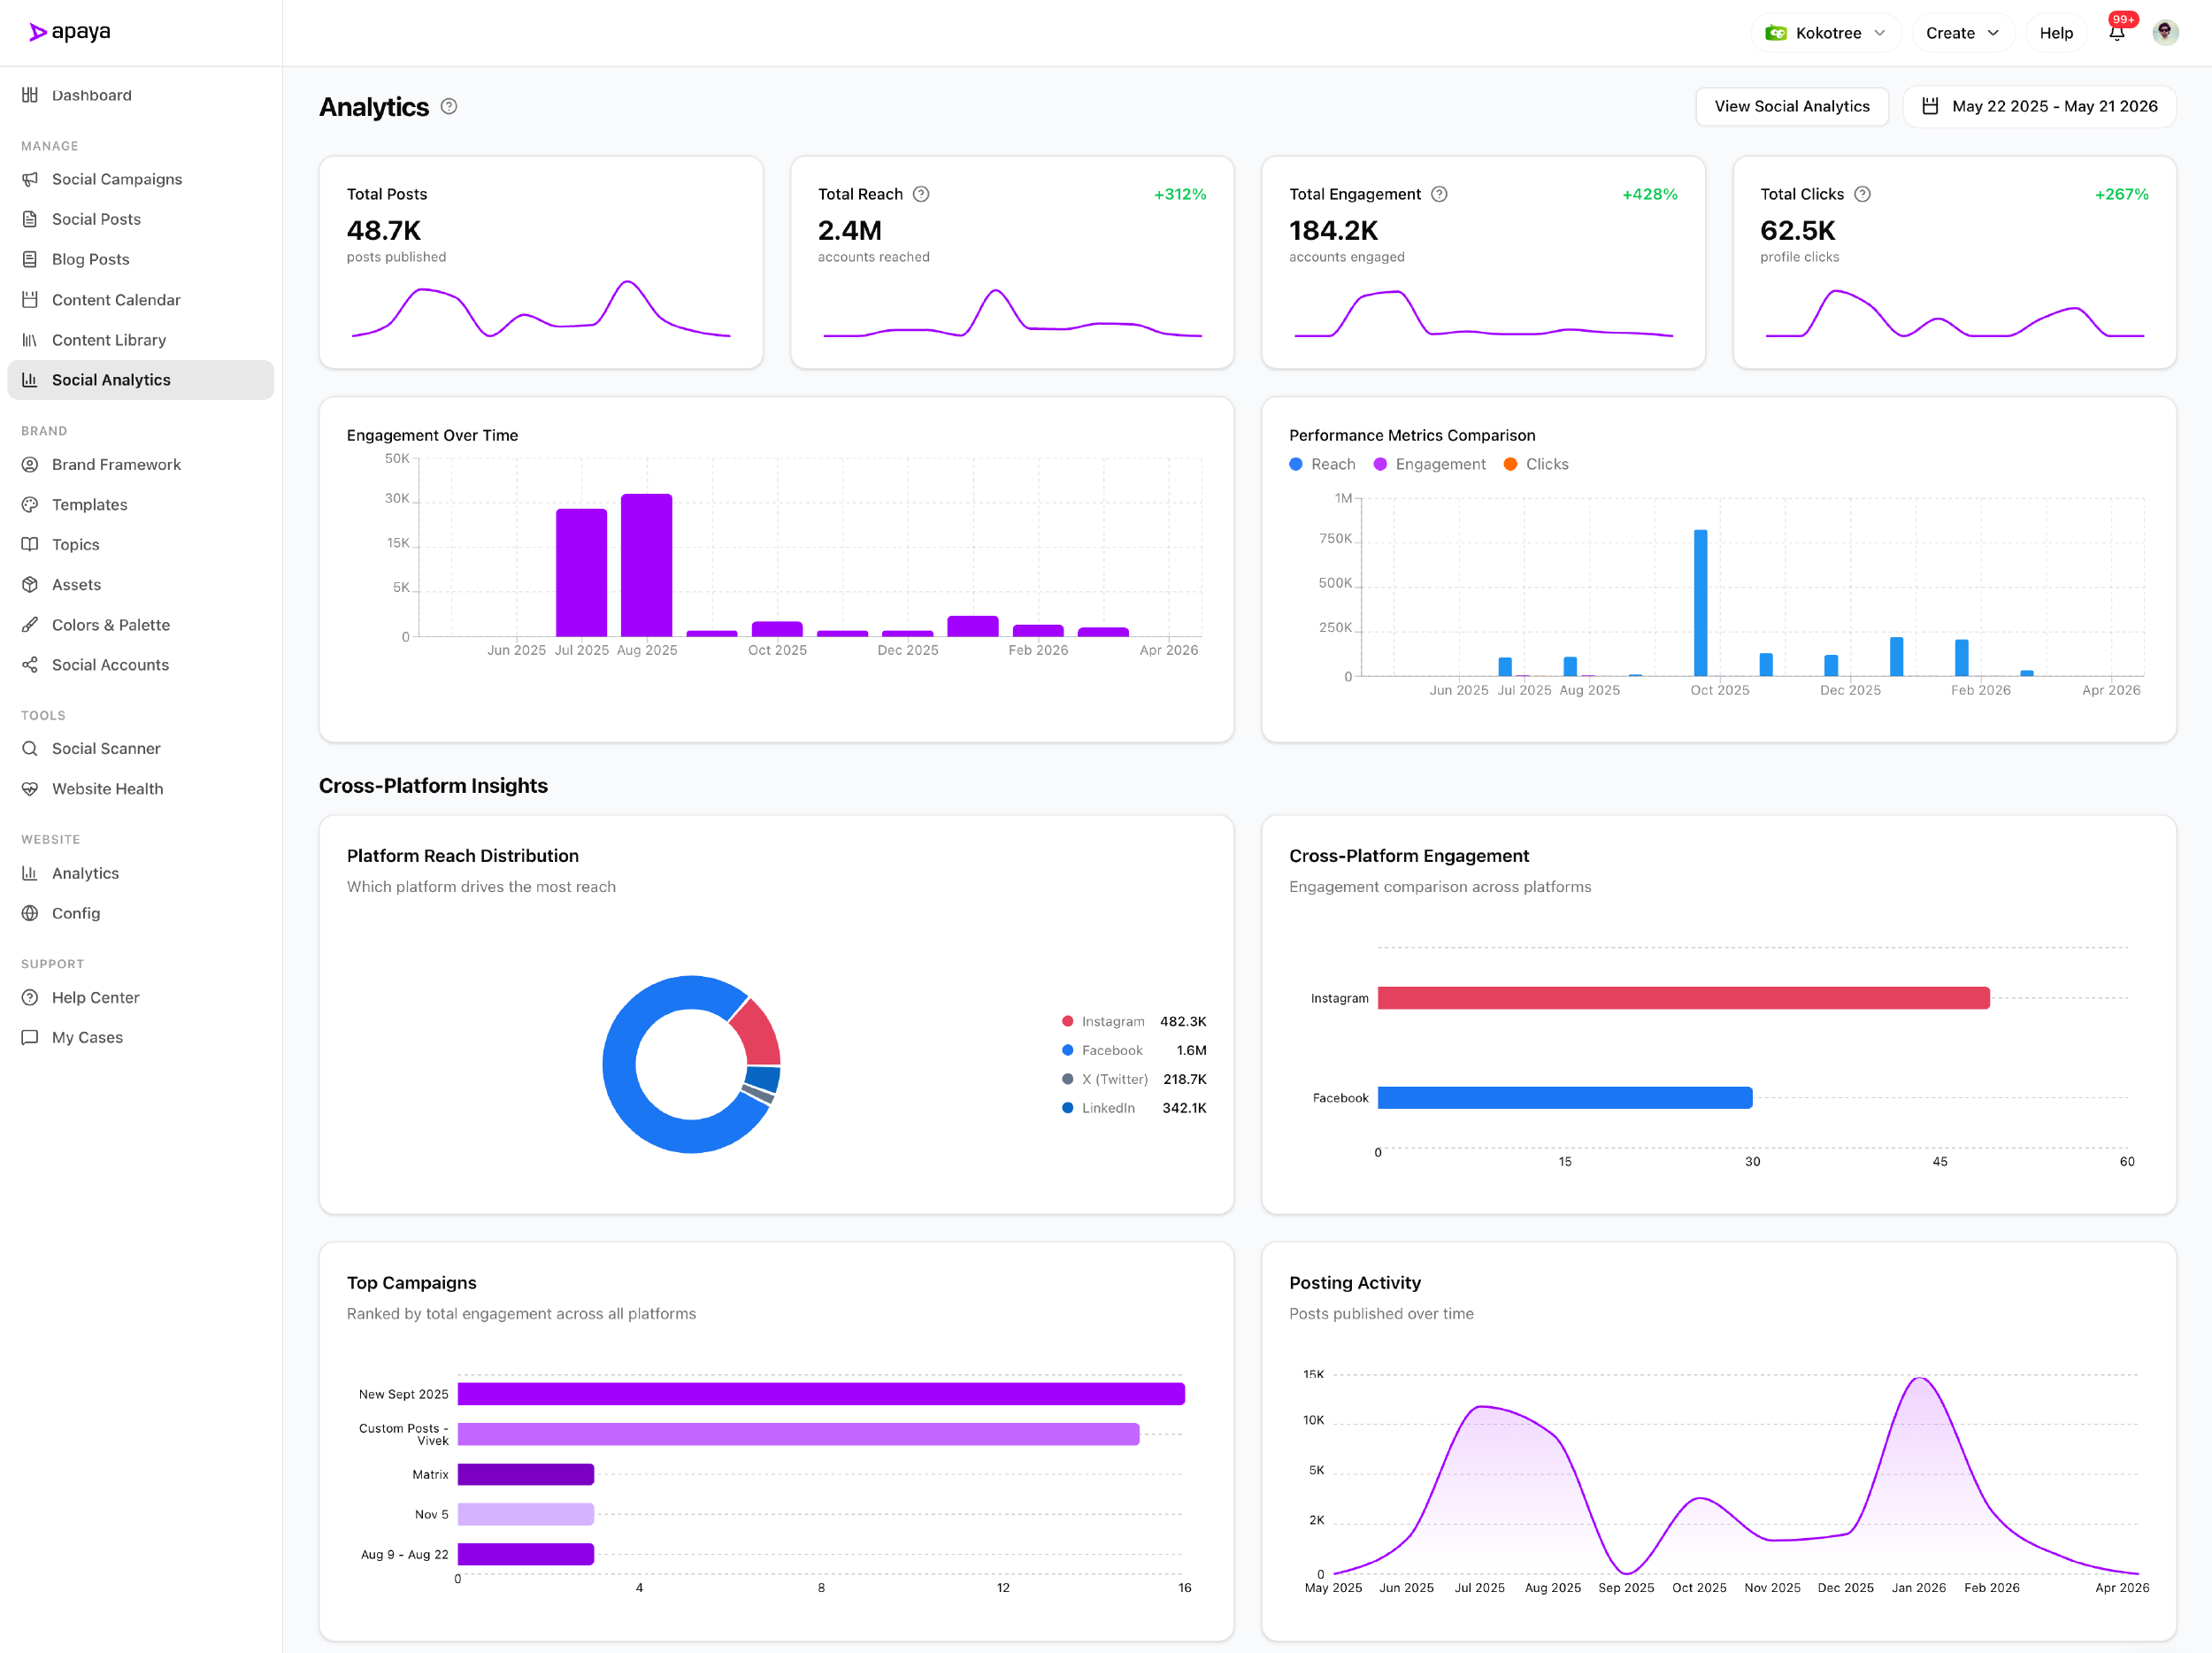
Inside the enterprise social media analytics dashboard
End of month. The CMO opens brand A’s analytics view.
Filters to the corporate launch campaign. Sees per-post engagement, channel-level reach, and impressions across LinkedIn, Instagram, Facebook, X, and TikTok. The campaign produced 48 posts; 12 cleared 1,000+ engagements; 3 cleared 10,000.
Switches to the brand with the tracker installed. Sees which campaign links drove website sessions, which pages those visitors viewed, and which tracked events followed the campaign.
Exports the brand report to PDF for the executive packet, CSV for the analyst, and Markdown for the company’s internal AI assistant. The exports capture the post-level numbers, the campaign rollup, and the attribution view in clean formats.
20 minutes for what used to be a half-day spreadsheet exercise.
What’s in the analytics layer
The capabilities behind the reporting:
- Analytics Overview. Brand-level performance summaries for each brand in the tenant.
- Time Filtering. Preset and custom date ranges.
- Campaign Analytics. Aggregated performance for every post in a campaign.
- Post-Level Analytics. Per-post engagement, reach, impressions, clicks.
- Platform Analytics. Per-channel performance with platform-specific metrics.
- Follower Statistics. Account-level follower counts and growth where the channel API exposes them.
- Per-brand dashboards. Each brand has its own analytics interface for posts, campaigns, channels, website activity, and conversion visibility where tracking is installed.
- Scoped enterprise reporting. Consolidated or custom executive views can be scoped for customers that need a parent-company reporting layer.
- UTM Tracking. Campaigns can append UTM parameters for attribution and downstream analytics.
- Website Intelligence. Visitor and session tracking, attribution reporting, behavior reporting where the Apaya tracker is installed on the brand’s website.
- Known-User Visibility. Anonymous visitors can connect to known users after login, signup, or form submission where the site is configured to pass that event.
- Acquisition Reporting. Campaign links, UTMs, and tracked website events connect social activity to website outcomes.
- PDF, CSV, and Markdown Exports. Clean exports for executive reporting, QBRs, board decks, spreadsheet work, BI, and AI/LLM analysis.
- Enterprise API Export. Tenant-scoped API access can expose analytics and reporting endpoints for buyers who want data in their own warehouse, internal tools, or agent workflows.
Website Intelligence and conversion attribution
Most social analytics stop at the channel API. The reach number tells you the post showed up. The engagement number tells you someone reacted. The click number tells you someone left the channel. After that, the channel cannot help.
Website Intelligence extends the reporting past the click. Buyers who install the Apaya tracker on the brand’s website see:
- Visitor and session activity from social-driven traffic
- Pageview and event behavior per visitor
- Source and campaign visibility from tracked links
- Known-user visibility after login, signup, or form submission where the site is configured to pass that event
The tracker is per brand and per website. Install is a single script tag. Data starts populating from the moment the tracker fires.

For buyers with an existing tracking and attribution stack, Apaya’s UTM tracking on every campaign feeds those systems through standard parameters. Apaya extends what the team can see from the social side while keeping social content, campaign, channel, post, and brand reporting inside the platform.
What Apaya reporting focuses on
Apaya reporting is built around the content production system. It shows what Apaya created, scheduled, published, and tracked for each brand. That keeps reporting tied to the same campaign, post, channel, brand, and website context the team used to create the work.
The point is not a disconnected analytics dashboard. The point is a reporting layer that stays attached to the brands, campaigns, posts, schedules, media, and website activity the enterprise team is already managing in Apaya.
Brand-level reporting for multi-brand tenants
Multi-brand operations need each brand’s reporting to stay clean. Apaya treats each brand as its own reporting unit inside the tenant.
Each brand dashboard can show:
- Post, campaign, and channel performance for that brand
- Website activity and conversion visibility where the tracker is installed
- Date range, channel, campaign, and status filters
- PDF, CSV, Markdown, and API exports for that brand’s reporting data
Brand owners see their brand’s analytics. Corporate marketing can move between the brands it has access to. When a customer needs a consolidated corporate reporting view, Apaya can scope that as an enterprise reporting layer.
For deeper coordination across brands, the multi-brand workspaces page covers the workspace model.
Exports and downstream systems
Reporting that stays inside the platform is reporting that is hard to use. Apaya supports clean exports:
- PDF export for executive summaries, QBRs, board packets, and shareable campaign reports.
- CSV export for spreadsheet work, BI import, and data warehouse workflows.
- Markdown export for reports, internal AI assistants, LLM analysis, agent workflows, and documentation.
- Enterprise API export for buyers who want analytics and reporting data in their own data warehouse, internal tooling, or automation layer.
Markdown is intentionally supported because enterprise teams increasingly analyze marketing performance with their own AI systems. Instead of copying a dashboard into a prompt, the team can export clean reporting text and feed it into the tools they already use.
For deeper integration patterns, the Enterprise API page covers brand-scoped API keys, webhooks, custom integrations, API-controlled workflows, and exportable reports.
What’s in production
Per-post, per-campaign, per-channel analytics live in the product. Website Intelligence is available for buyers who install the tracker and want campaign links, website activity, and conversion events connected inside the reporting view.
How analytics gets started
Analytics starts once social accounts are connected and approved posts begin publishing. Apaya pulls performance data from the connected social platforms on a daily cadence, so reporting begins after the first published posts have platform data available.
- Connect social accounts. Each brand connects the channels it publishes to, including LinkedIn, Instagram, Facebook, X, and TikTok.
- Publish approved posts. Once posts go live, Apaya reports performance by post, campaign, channel, and brand.
- Install website tracking during onboarding. Buyers who want conversion visibility can install the Apaya tracker while the brand is being set up, so website activity is ready to connect to campaign links and UTMs.
- Review what is working. Teams can see engagement, clicks, comments, likes, impressions, and other available platform metrics per post and per brand.
- Scope enterprise reporting where needed. Consolidated reporting and custom executive views can be scoped for enterprise customers that need a specific reporting layer across brands, divisions, or locations.
As publishing volume builds, analytics gives the team a clearer view of what worked by post, campaign, channel, and brand. Teams can use that information when planning the next campaign or updating brand guidance.
Frequently asked questions
What metrics does Apaya report?
+
How does Website Intelligence work?
+
Can we connect social content to website conversions?
+
Can enterprise customers get consolidated reporting?
+
Why is LinkedIn Personal analytics limited?
+
Can we export analytics?
+
What does Apaya analytics focus on?
+
Related
-
Scheduling & publishing
Enterprise social media scheduling software with dedicated brand calendars, timezone-aware publishing, lifecycle states, retries, and analytics.
-
AI content production
AI social media content pipeline automation for campaigns, assets, captions, graphics, approvals, scheduling, publishing, and analytics.
-
Enterprise API
Enterprise social media platform with API access, exportable CSV and PDF reports, webhooks, brand-scoped client workspaces, and AI agent workflows.
-
Implementation plan
A practical Apaya Enterprise implementation plan for launching social content production across brands, assets, templates, approvals, publishing, reporting, API access, and support.
Schedule an Apaya Enterprise demo.
See how Apaya helps your team produce more on-brand social content across every brand without adding headcount.