Social Media Report Template for Agency Clients
Written by: Tim Eisenhauer
Last updated:

The easiest way to keep your social media profiles active.
Learn more about Apaya →
Most social media reports are platform exports with a logo added. They show that numbers moved. They do not tell the client what changed, why it matters, or what the agency needs to do next.
This template is built around the client conversation, the same reporting structure agency reporting and analytics assembles automatically in Apaya. It includes an editable presentation, a companion data workbook, and a completed fictional example so you can see the intended level of detail before replacing the data.
Download the social media report deck (.pptx) →
Download the report data workbook (.xlsx) →
Both files are ungated. The Northstar Dental example is fictional and clearly labeled inside the files.
What changed about social media reporting.
Organic social is not a dependable free-reach engine for every brand. Feed competition is high, engagement rates have declined across major platforms, and paid media offers more predictable distribution. That does not make an active organic presence worthless.
For many businesses, organic social now has one or more narrower jobs:
- Show that the company is active and credible when a buyer checks
- Give prospects proof, expertise, and current offers to validate a decision
- Support branded-search and social-platform discovery
- Equip salespeople with useful content
- Answer customers and surface recurring questions
- Support recruiting and employer reputation
- Test messages and creative themes before or alongside paid distribution
- Capture high-intent profile, website, and inquiry actions
Our social media statistics page keeps the primary research and its limitations in one place. The practical consequence for reporting is simple: agree on the job first, then choose the evidence. Do not force every program into reach, engagement, follower growth, and leads.
The social media report template at a glance.
The deck has 13 slides:
- Cover and reporting period
- Ninety-second executive summary
- Business objective and social’s assigned job
- Work delivered and service health
- KPI scorecard with actual, prior period, target, and trend
- Active-presence and buyer-validation signals
- Discovery and audience quality
- Website, inquiry, and business outcomes
- Top and weak content with reasons
- Community, reputation, and customer-care findings
- Paid performance, visibly separate and only when applicable
- Next-period tests, decisions, owners, and dates
- Metric definitions, data sources, and limitations
The workbook stores the underlying values, calculations, content detail, community themes, paid results, experiments, and definitions. It is not an automated API connection. That is intentional: the agency can use exports from the client-approved platforms and analytics systems without giving a presentation file direct account access.
Start with the decision, not the data.
Before adding a chart, write down what the client will decide from the report. Common decisions include:
- Continue, stop, or adjust a content theme
- Put paid distribution behind a proven message
- Provide the agency with more customer stories or subject-matter access
- Change the response or escalation process
- Update an inactive or incomplete profile
- Improve tracking on a landing page
- Shift production toward a format producing higher-quality actions
A metric that cannot change a decision may still be useful context. It should not dominate the report.
Match the scorecard to the job.
Use this table to choose the first five to eight measures. Add platform detail in the appendix rather than turning the executive scorecard into an analytics warehouse.
| Job assigned to social | Useful measures | Evidence to add |
|---|---|---|
| Active presence | Publishing completion, days since last post, profile completeness, response-time service level, agreed content-category coverage | Missing fields, outdated offers, or unresolved messages |
| Discovery | Reach, non-follower reach, impressions, qualified follower growth, shares, video watch time or completion | Search terms, audience fit, and distribution source |
| Buyer validation | Profile visits, saves, customer-proof posts, substantive comments and direct messages, returning social visitors | Questions prospects asked and proof used by sales |
| Website consideration | UTM clicks, click-through rate, GA4 engaged sessions, resource downloads, demo or contact actions | Landing-page fit and attribution limitations |
| Community or care | Inbound questions, response rate, median response time, resolutions, recurring themes | Examples with personal information removed |
| Leads or revenue | Qualified inquiries, attributed leads, assisted conversions, opportunity value | Attribution method and confidence level |
| Paid distribution | Spend, CPM, frequency, CTR, CPC, CPL or CPA, and ROAS where revenue data is reliable | Audience, placement, creative, and conversion-window context |
| Learning | Hypothesis, result, conclusion, and next action | What will change because of the finding |
For platform-level context, compare results with the relevant tables in our social media benchmarks guide. A benchmark is context, not a target. A local professional-services firm and a national entertainment brand should not expect the same engagement rate.
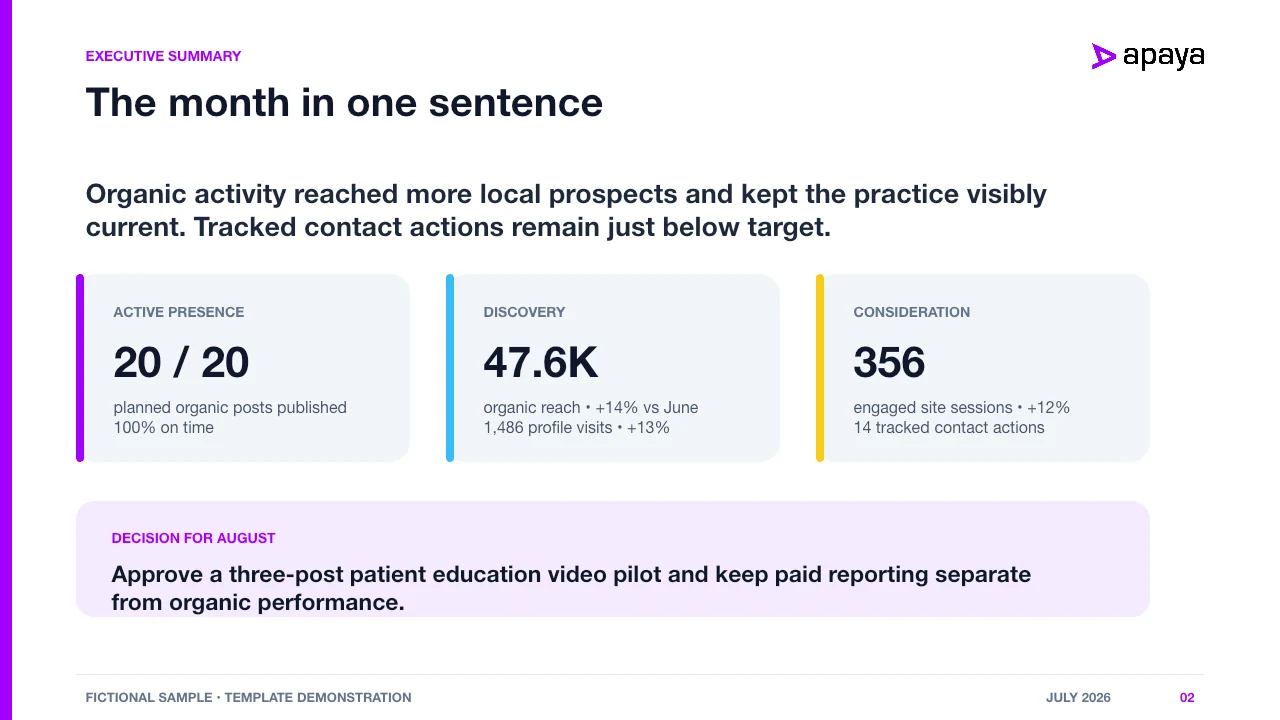
Slide 2: the ninety-second executive summary.
Write this slide last. It should answer four questions in plain language:
- What improved?
- What missed the plan?
- What does the agency think caused it?
- What happens next?
Here is the structure used in the fictional example:
Result: Website visits from tracked social links increased while publishing stayed on plan.
Miss: Non-follower reach fell, concentrated in static promotional posts.
Meaning: Educational short video produced stronger discovery and qualified site activity than offer-led graphics. Attribution remains directional because some profile and dark-social visits are untagged.
Next action: Produce three short educational videos, keep one proof post per week, and pause the lowest-performing promotional format. The client needs to approve two subject-matter-expert recording slots by the date shown.
Notice what is missing: a victory lap about impressions. The summary tells the client what the result changes.
Slide 3: define social’s assigned job.
Record the business objective, the job social is expected to perform, the audience, and the primary action. This keeps the report from changing definitions whenever a metric has a good month.
Example:
| Field | Fictional example |
|---|---|
| Business objective | Increase qualified consultation demand |
| Social’s job | Buyer validation and local discovery |
| Priority audience | Adults researching elective dental services within the service area |
| Primary action | Visit a service page or request a consultation |
| Guardrail | Do not use patient imagery or claims without documented permission and approval |
Slide 4: show the work delivered.
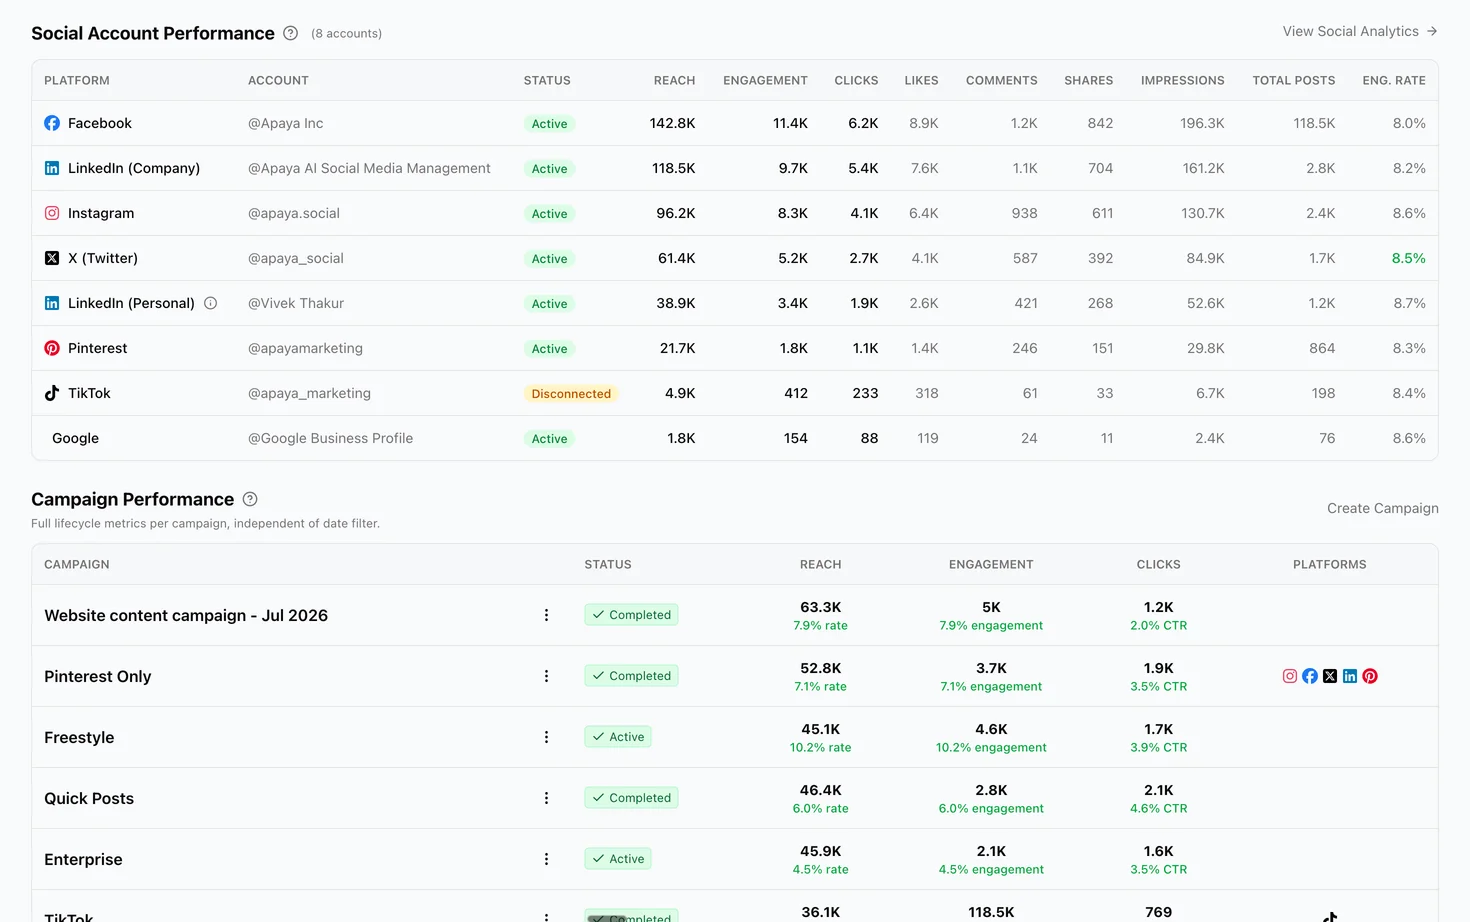
Clients should not have to infer service delivery from outcome metrics. Report what the agency committed to and what happened:
- Planned versus published assets
- Channel and format mix
- Approval turnaround and late-client dependencies
- Community coverage delivered
- Tracking or profile-maintenance work
- Material scope changes
Keep missed work visible. Label the cause without turning the slide into blame: agency capacity, client approval, unavailable source material, platform issue, or an agreed strategic change.
Slide 5: build a useful KPI scorecard.
Every row needs the current result, comparison period, target or expected range, direction, and one sentence of interpretation. Use n/a when a metric has no responsible target.
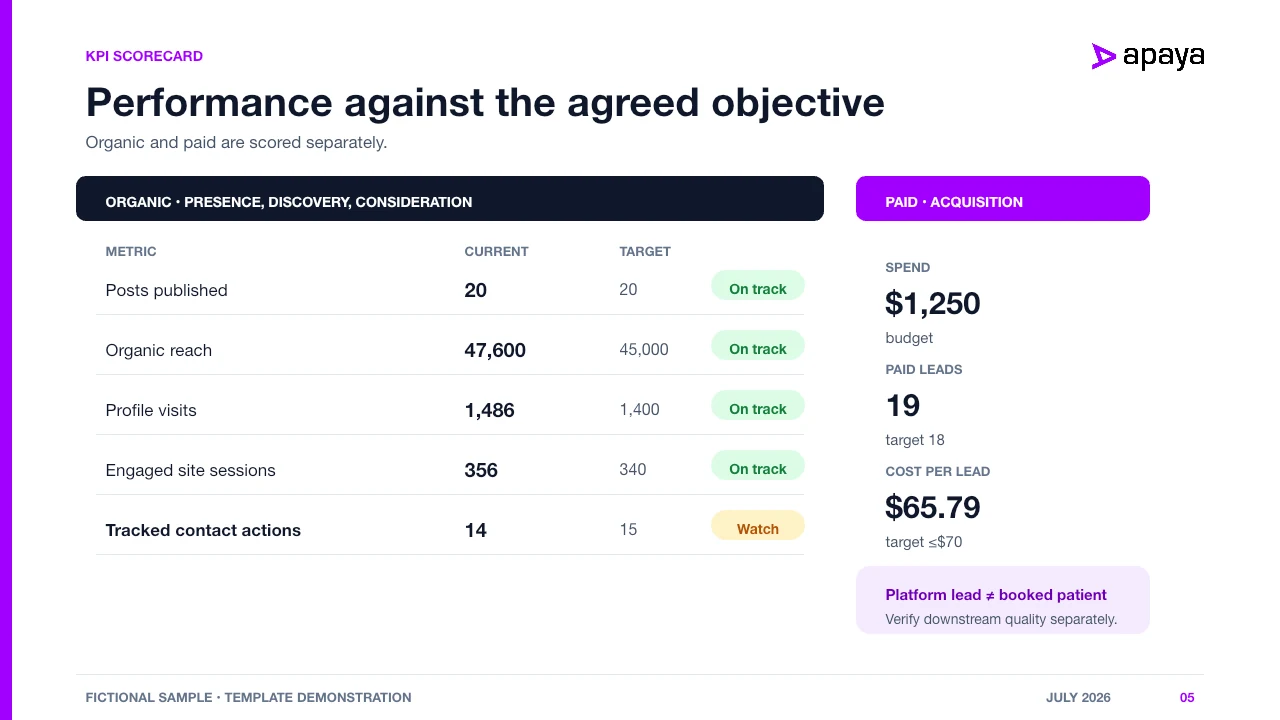
Avoid red and green based only on whether a number rose. Lower cost per qualified lead is usually good. Lower response time is good. Lower reach might be acceptable if the content drove more qualified actions. The workbook includes a direction field so the meaning is explicit.
Slides 6 through 8: move from platform activity to business evidence.
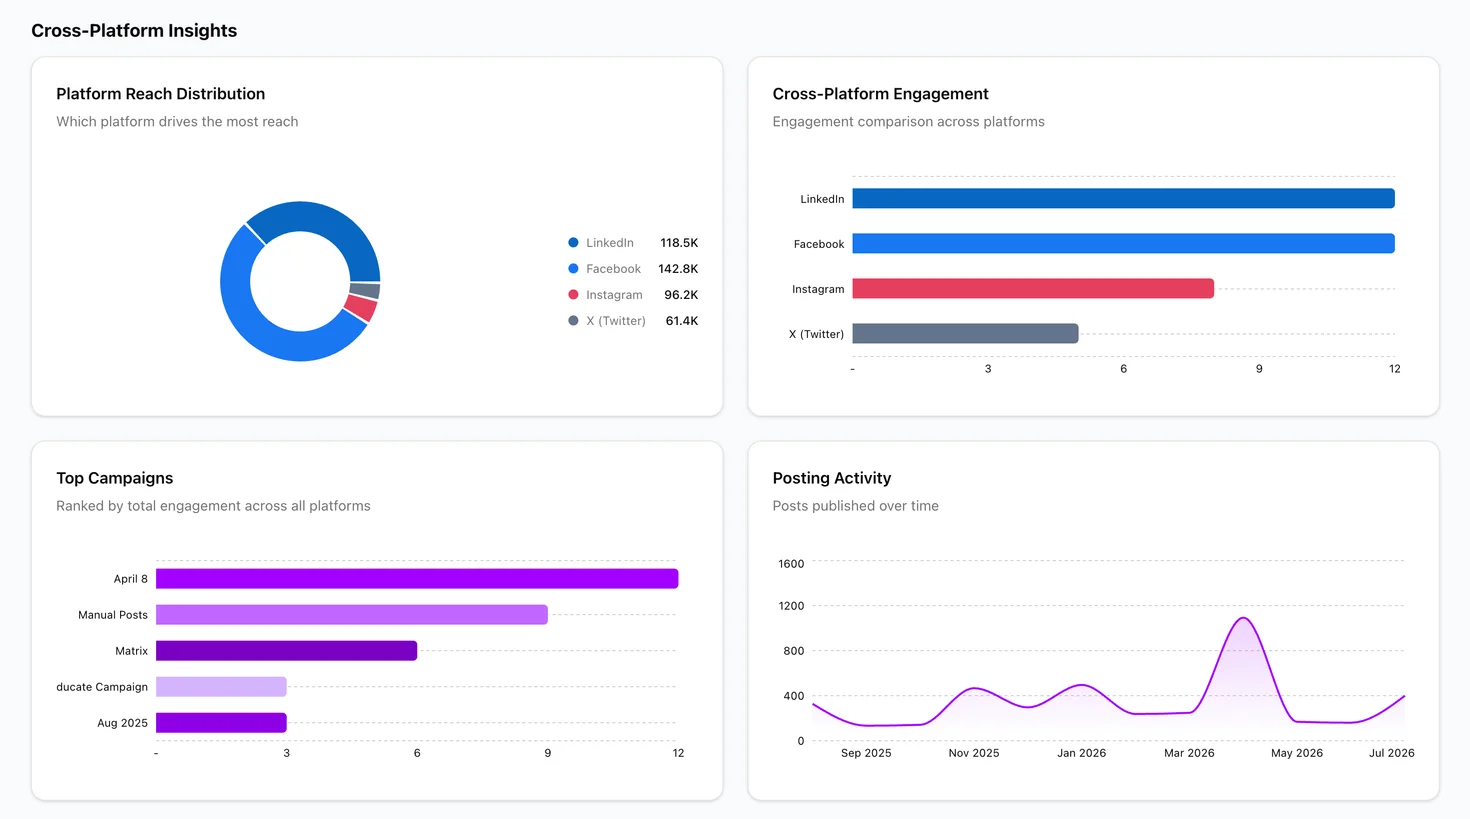
Active presence and trust proxies.
Call these measures proxies. A complete profile, recent post, case study, save, returning visitor, or substantive message may support trust. None directly measures a person’s trust.
Pair the numbers with visible evidence:
- Which proof posts shipped?
- What questions appeared more than once?
- Did prospects mention social content in calls or forms?
- Did sales reuse any posts?
- Were profiles accurate and current throughout the period?
Discovery and audience quality.
Separate follower and non-follower distribution when platforms provide it. Report audience fit, not just audience size. A small increase among the right geography, role, or customer group may matter more than a large burst of irrelevant views.
Website and inquiry outcomes.
Use UTMs consistently and document the analytics source. Separate:
- Directly attributed conversions
- Assisted or view-through conversions
- Self-reported influence
- Unattributed inquiries that may have involved social
Do not merge those into one confident revenue number. Add an attribution-confidence field: high, medium, or low, with the reason.
Slide 9: explain both top and weak content.
A gallery of winning posts produces compliments. A useful analysis produces a test.
For each selected asset, include:
- Thumbnail and content ID
- Objective and format
- Result against the relevant metric
- Likely reason, clearly labeled as an interpretation
- Reusable lesson
- Next action
Include at least one weak asset. The question is not “Why did this flop?” It is “What did this teach us that changes the next batch?”
Slide 10: report the conversation around the content.
If community management is in scope, include response service levels and outcomes. If it is not, report only the observations the agency is authorized to collect and state that response coverage is excluded.
Useful qualitative themes include:
- Repeated questions or objections
- Product confusion
- Positive proof worth repurposing, subject to permission
- Complaints requiring an operational owner
- Language customers use to describe the problem
- Potential content ideas generated by real questions
Remove personal information from screenshots and examples.
Slide 11: keep paid media separate.
Paid and organic can appear in one deck, but they should never share a blended reach, click, or conversion total. Paid performance has budget, auction, frequency, audience, and attribution-window context. Organic performance does not.
If the agency does not manage paid social, delete the slide. Do not fill it with boosted-post data that nobody owns.
Slide 12: turn findings into commitments.
The action plan is the most important slide in the deck. Every row needs a hypothesis, action, owner, due date, and success or stop condition.
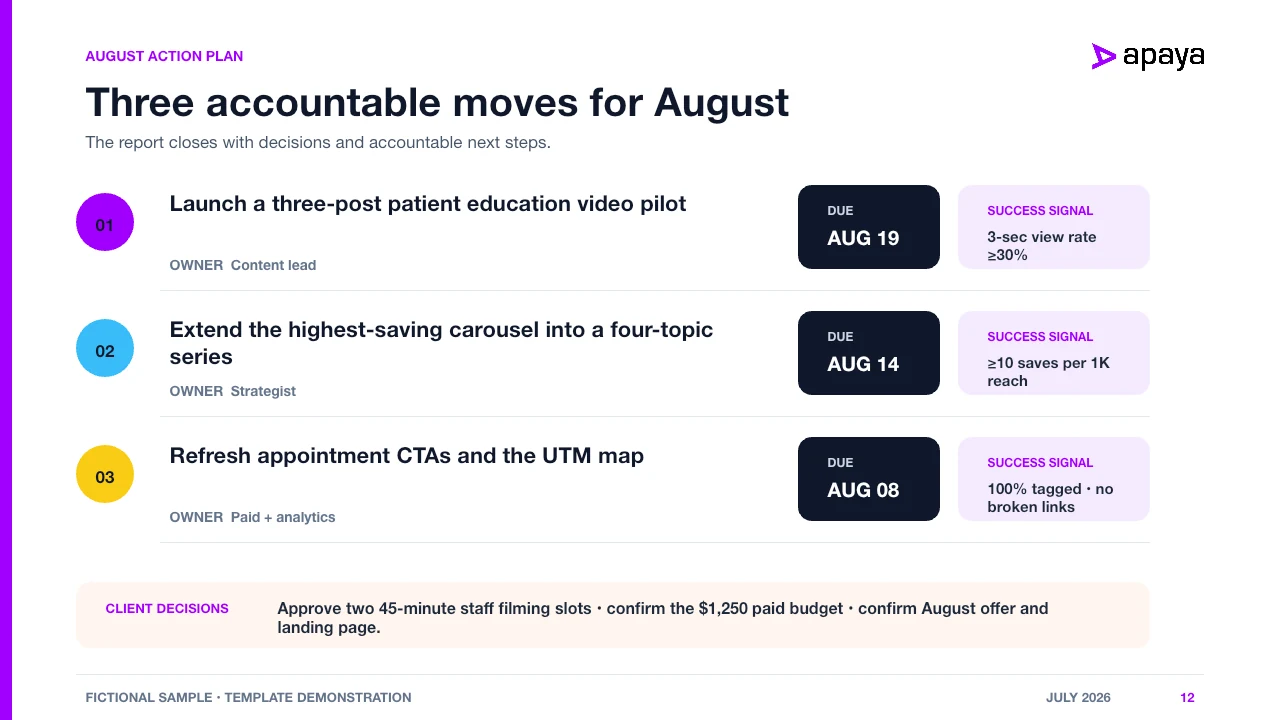
Use three categories:
- Continue: evidence supports keeping the approach.
- Change: enough evidence exists to alter the plan.
- Test: uncertainty remains, so define the smallest useful experiment.
Include client decisions on the same slide. “Send more photos” is not a commitment. “Client marketing lead approves two recording dates by August 12” is.
Slide 13: definitions and limitations.
This slide prevents quiet changes in measurement. Record:
- Reporting period and time zone
- Connected accounts and missing data
- Data source for each metric
- UTM convention
- Conversion and attribution windows
- How paid and organic are separated
- Metric definitions that vary by platform
- Any platform restatements or collection gaps
- Whether comparison periods contain the same number of days
Keep a change log when a platform alters a definition. A trend line is misleading when the underlying metric changed halfway through it.
How often to report.
Monthly is a practical cadence for most agency retainers because it gives enough time to publish, learn, and make a new plan. It is not a universal rule.
- Use a live dashboard for monitoring and pacing.
- Use a short weekly note during launches, crises, or fast paid tests.
- Use a monthly report for operational decisions.
- Use a quarterly review for positioning, channel mix, budget, and larger scope decisions.
Do not turn weekly reporting into four miniature monthly decks. Report only what can change at that frequency.
What to remove from a client report.
- Every metric the platform exports
- Unsupported explanations stated as fact
- Vanity-number celebration with no objective
- Blended paid and organic totals
- A mysterious proprietary “trust score”
- Screenshots without interpretation
- Competitor data gathered through methods the client cannot verify
- Recommendations with no owner or date
- Data whose definition changed without disclosure
Reporting decisions the template needs to handle.
What should a social media report include?
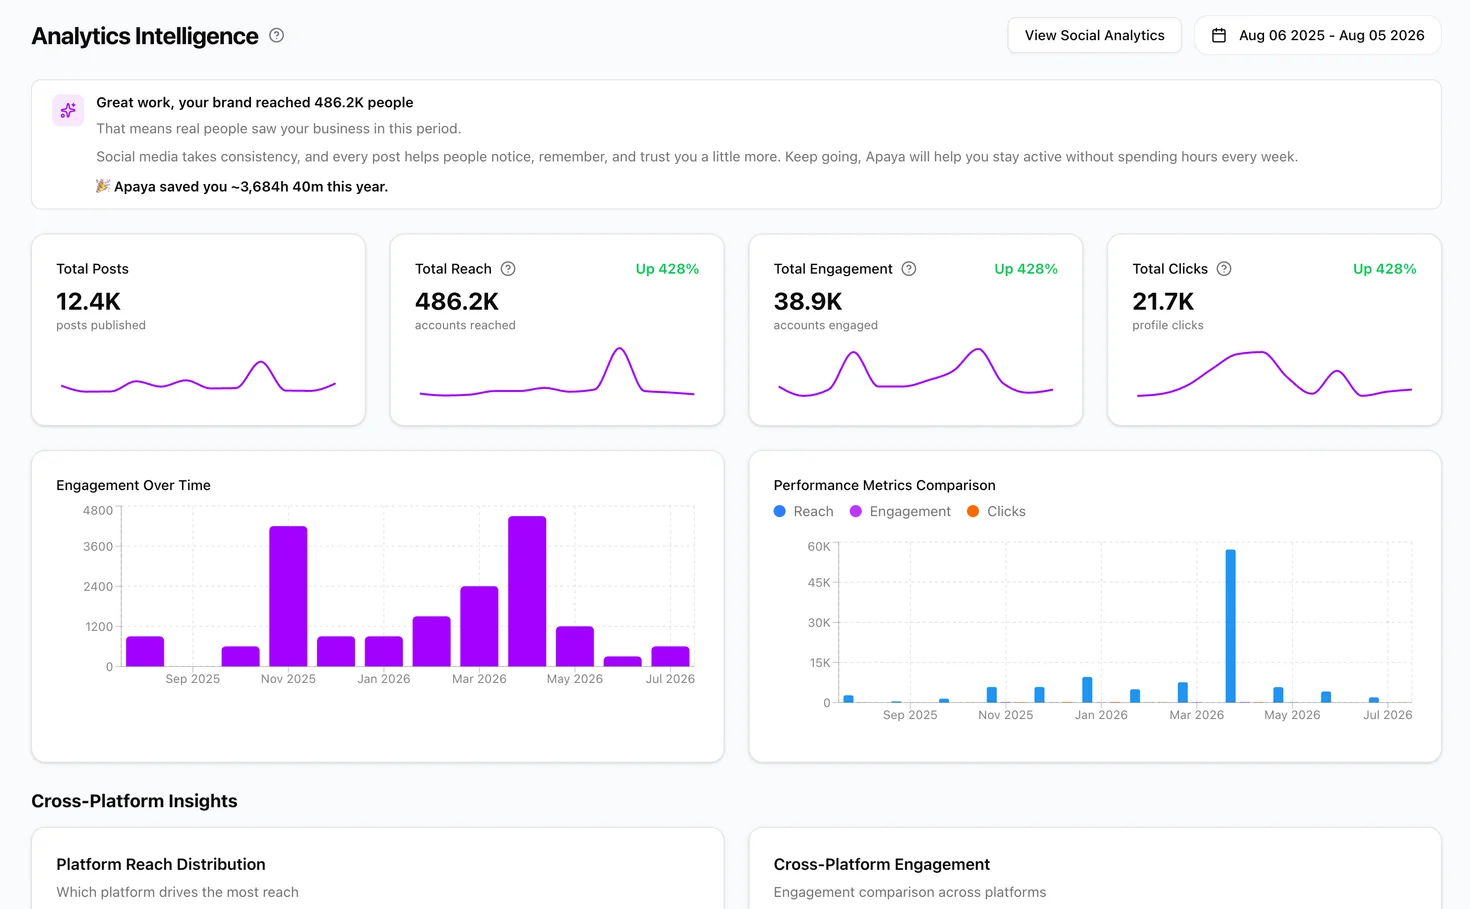
Include the executive interpretation, assigned objective, work delivered, focused scorecard, period context, content analysis, business evidence, client decisions, next-period tests, and definitions. Channel exports belong in an appendix.
How do you report organic social when reach is low?
State the reach result, then assess the job organic was assigned. Active presence, buyer validation, customer care, sales reuse, and tracked actions can matter even when broad distribution is weak. Do not invent a success story, but do not reduce the whole program to reach either.
Can a report measure trust?
Not directly. Use labeled proxies and qualitative evidence. Profile visits, saves, proof content, returning visitors, and substantive messages can support an interpretation about buyer validation, but they are not a direct trust measurement.
Should paid and organic appear in the same report?
Yes, if one client team needs the combined view. Keep separate scorecards, explanations, and attribution. Paid buys distribution. Organic usually supports presence, discovery, validation, care, and learning.
Download the editable templates.
Use the PowerPoint report template for the client narrative and the Excel data workbook for the underlying numbers, content analysis, and experiments. Replace the fictional example, confirm every definition, and delete slides that do not match the scope.
If you want reporting connected to the same workflow that produces, approves, schedules, and publishes the content, see Apaya’s agency reporting and analytics. Agencies delivering the report under their own identity should also review the white-label social media reporting guide.
Try it for 3 days • $0 today • Cancel anytime
The easiest way to keep your social media profiles active.
Apaya writes the posts, designs the graphics, and publishes them for you. You approve.
See how Apaya worksThe easiest way to keep your social media profiles active.
Apaya writes your posts, designs your graphics, and publishes everywhere — automatically.