Social media analytics
Every platform's numbers, in one place.
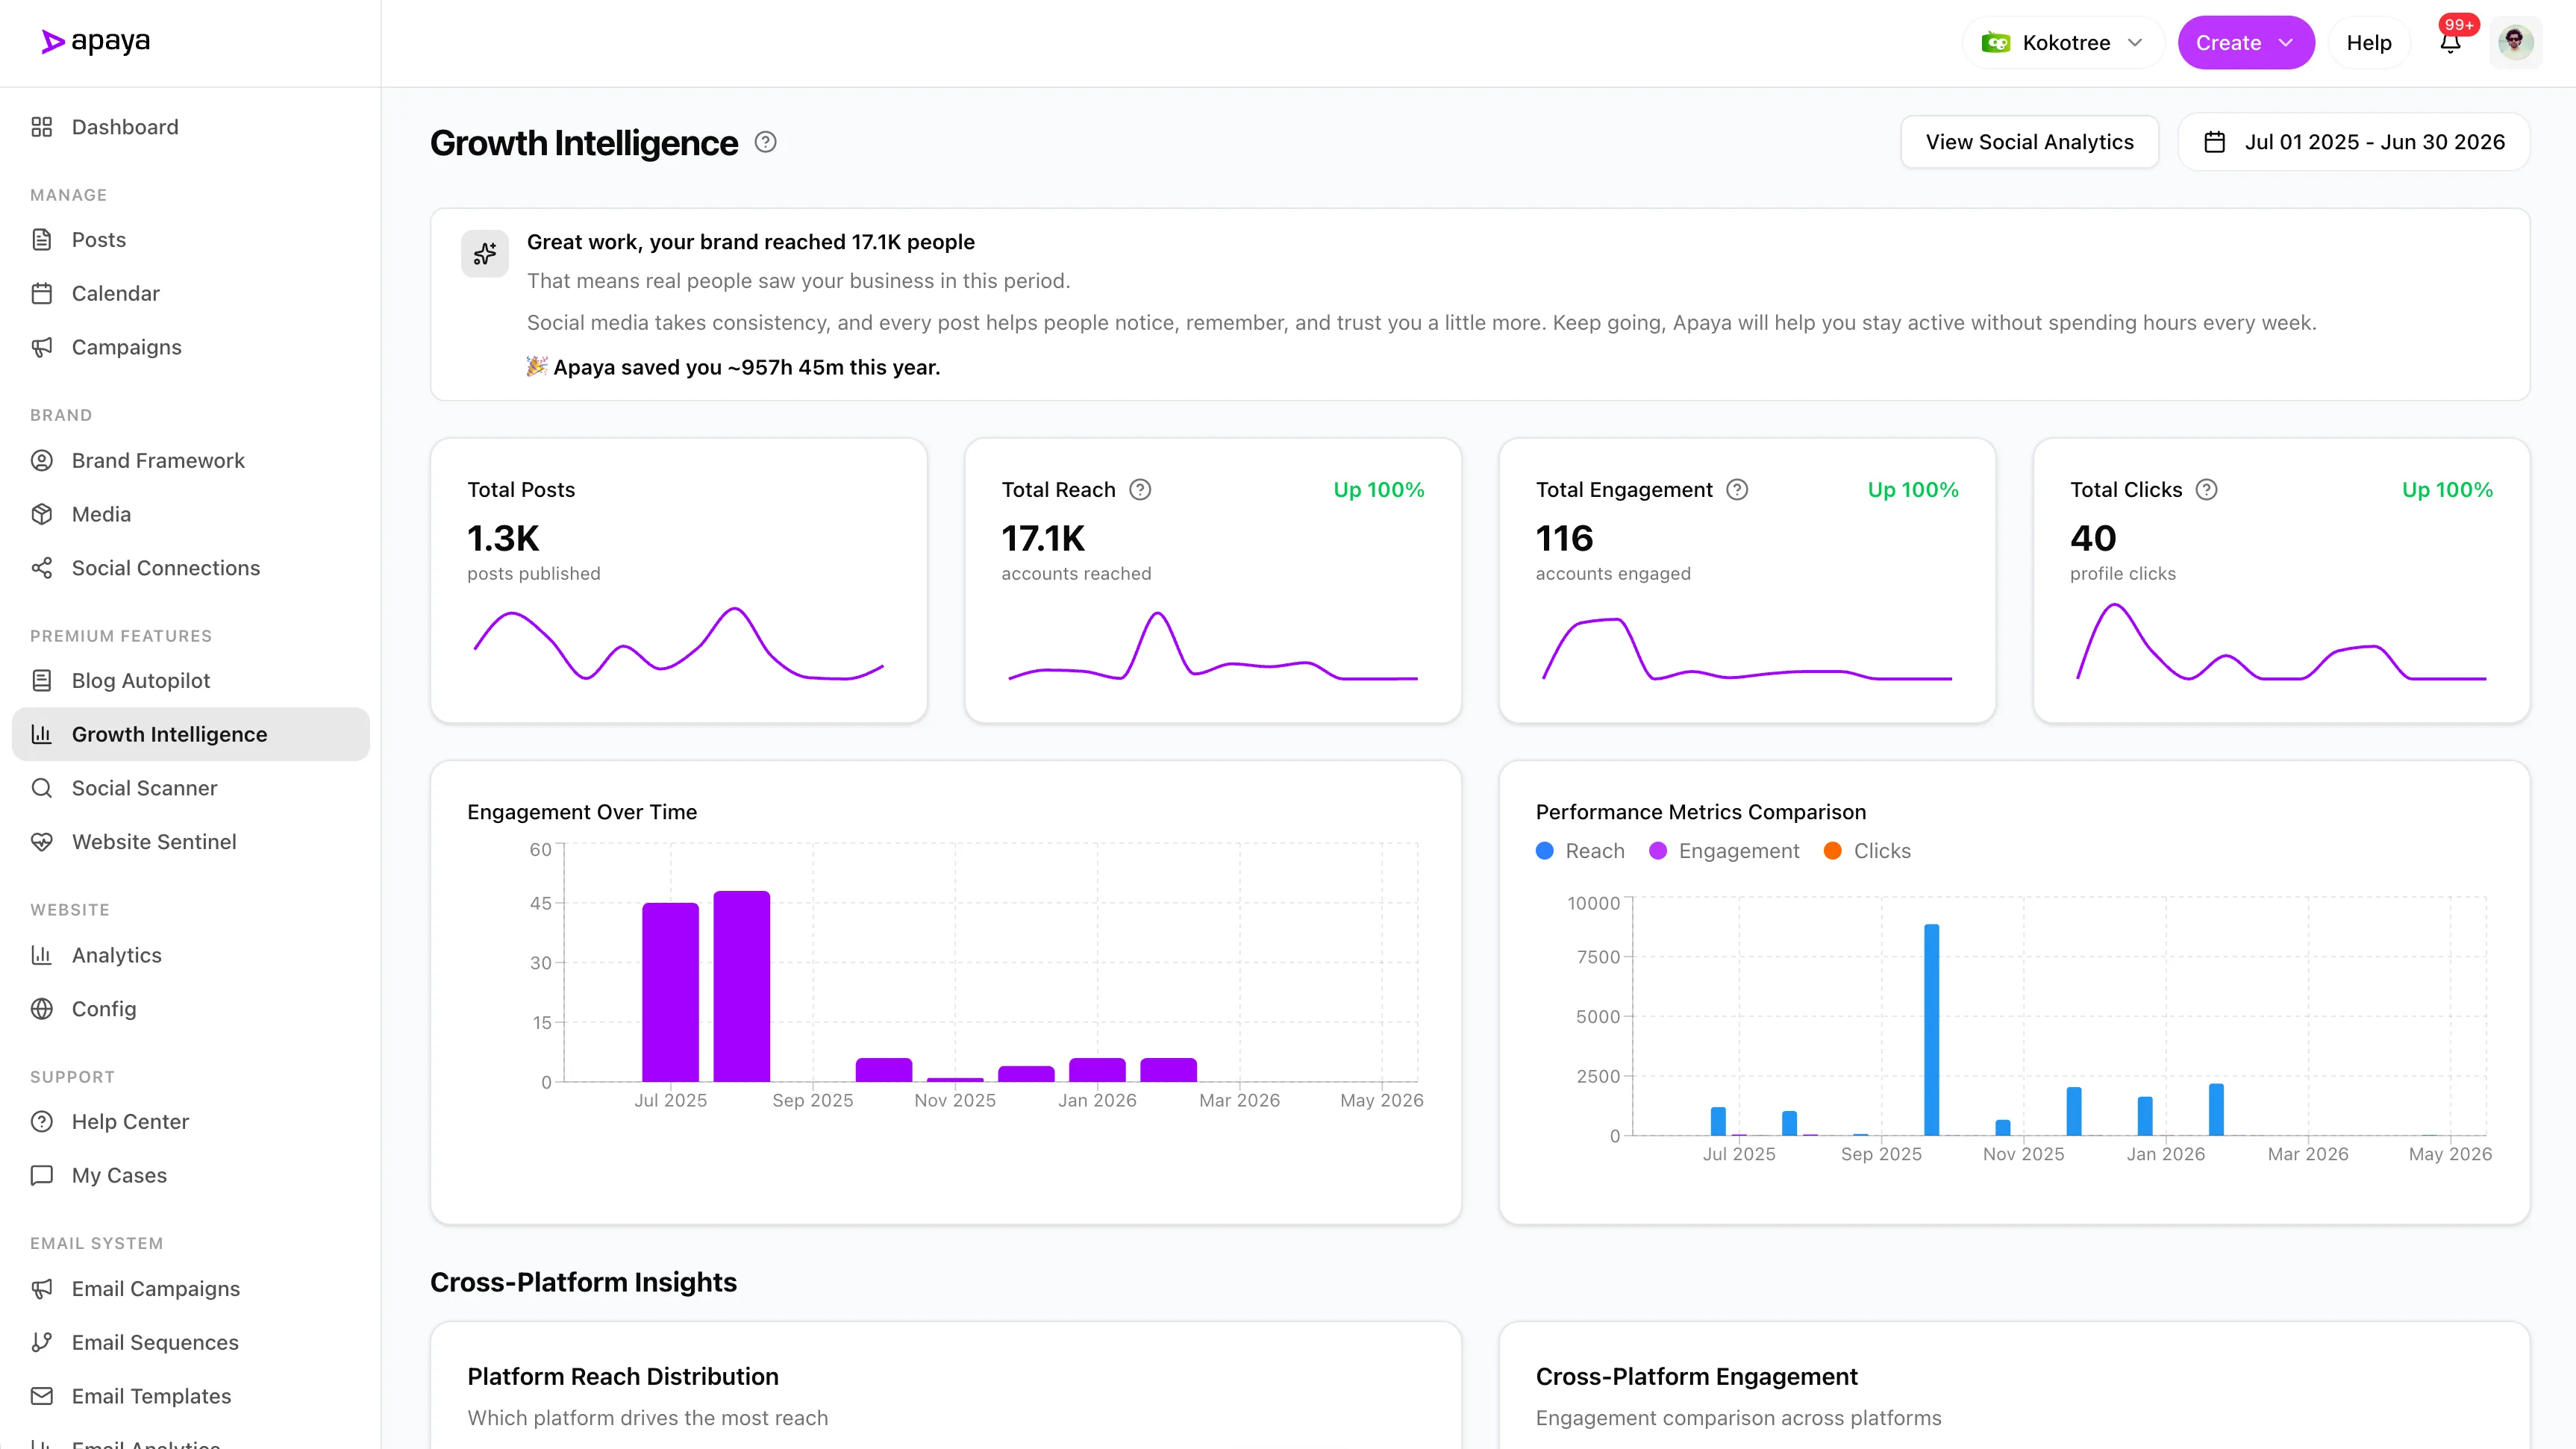
Apaya pulls reach, engagement, clicks, and posts from every account you've connected into one dashboard. Instagram, Facebook, LinkedIn, X, TikTok, and Pinterest, side by side, so you stop logging into six apps to see how you're doing.

Your results are scattered across six apps.
Instagram in one tab, Facebook in another, then LinkedIn, X, TikTok, and Pinterest. Every dashboard looks different, none of them add up, and by the time you've pieced it together the afternoon is gone. So most people just stop checking.
From scattered numbers to one clear picture.
Connect your accounts.
Link Instagram, Facebook, LinkedIn, X, TikTok, and Pinterest once. That's the whole setup.
Apaya gathers the numbers.
It pulls reach, engagement, and clicks from every account for you. No exporting, no spreadsheets, no stitching tabs together.
See what's working.
One dashboard shows how every platform, post, and campaign is doing, over any date range you pick.
All in one place
Reach, engagement, and clicks in one view.
Your totals across every connected account, with each platform broken out beside the others. Pick any window, from the last 7 days to the past year, and every number shows how it moved against the period before.
- Totals for reach, engagement, clicks, and posts
- Every platform compared in one chart
- Any date range, with growth on every number
Every platform's numbers in one place.
Per account
See which accounts pull their weight.
Not every platform earns the same effort. Apaya shows each account's reach and engagement rate next to the others, so you can lean into what's working and stop pouring hours into what isn't.
- Reach and engagement rate per account
- Your strongest and weakest platforms, at a glance
- A clear read on where your time pays off
Reach and engagement, last 30 days.
Per post
Find your best posts, then make more of them.
Every post shows its reach, impressions, and engagement, and how it did against your own average. The winners are obvious, so you can repeat what lands instead of guessing.
- Reach, impressions, and engagement per post
- How each post did versus your average
- A simple read on the formats to repeat
vs your 30-day average
See what works, then make more of it.
The posts you measure here are the same ones Apaya can write, schedule, and publish for you. So the moment you spot a winner, you can turn it into your next batch without leaving the app.
Results from businesses like yours.
Your social media could look like this too.
"We went from posting once a week — when we remembered — to daily thought leadership on LinkedIn and Instagram. Engagement doubled in weeks, and nobody on our dev team had to touch it."
 Abhisek Sharma Owner at SCP Technologies
"I used to spend my Sunday nights writing posts for the week. Now Apaya handles our customer stories and promotions automatically. Inquiries are up 25% and I got my weekends back."
 Sarah Chen Owner at BerksConnect
"We manage social for 50+ clients. Before Apaya, that meant 50+ content calendars built by hand. Now the AI drafts everything and my team just refines. We cut production time by 40% and our clients are getting better results."
 Mike Patel Director at Resultris Agency
"Our social traffic was flat for a year. We switched to Apaya and within two months, social traffic was up 20% and sales from social channels grew 15%. The posts are consistent and sound like us."
 Emma Lopez Manager at Toperty
"I'm a one-person marketing team. Before Apaya, I'd go weeks without posting. Now we publish daily across three platforms. Followers grew 25% in three months and I spend maybe 20 minutes a week reviewing posts."
 Jordan Kim Director at Doors4Jobs
Ready to see it work for you?
Start Your 3-Day Free TrialTry it for 3 days • $0 today • Cancel anytime
Get started with Apaya.
Plans from $59/month. Start with a 3-day free trial — cancel anytime.
- AI content generation in your brand voice
- Automated scheduling and publishing
- Brand framework + social analytics
- Review and approve, or run hands-off
Self-serve plans
From $59/mo
Billed annually. Monthly billing available.
Start Your Free TrialTry it for 3 days • $0 today • Cancel anytime
Want it done for you?
Managed+ at $1,299/mo — our team runs your social media for you, with a dedicated strategist.
Learn about Managed+ →Social Media Analytics FAQs
Common questions about tracking your results in Apaya.
Which platforms does Apaya track?
What metrics does it show?
Can I compare one platform against another?
Can I choose a date range?
Does it track individual posts?
Can I see how a whole campaign performed?
Know what's working, at a glance.
Every platform's numbers in one dashboard, so you can do more of what works and less of what doesn't.
Start Your Free 3-Day TrialTry it for 3 days • $0 today • Cancel anytime